Rapture #165: BTC On-Chain Analytics Update


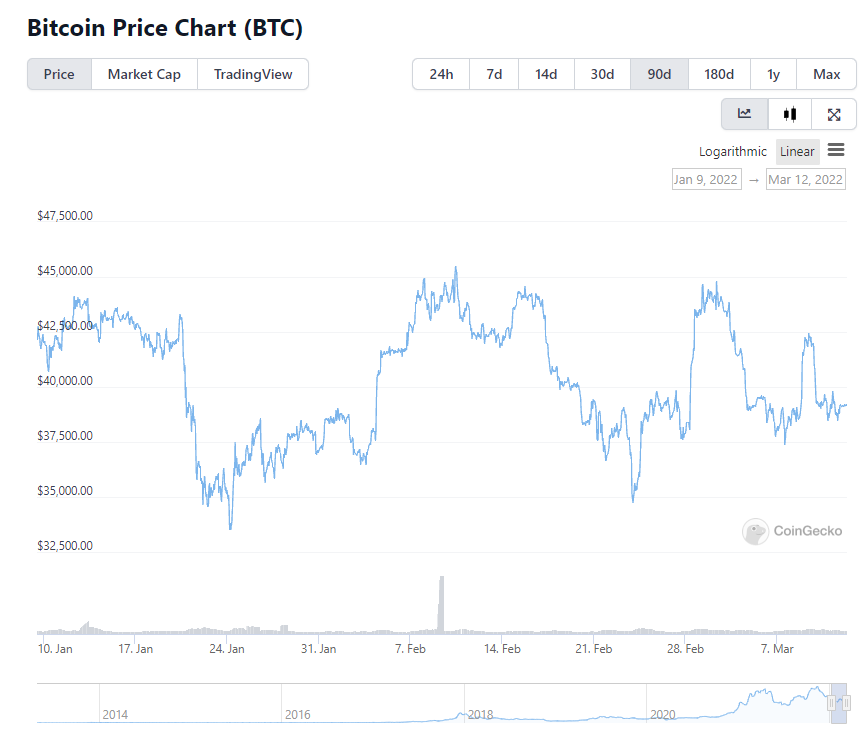
Over the next two weeks, BTC will likely tell us what direction the next short term trend will be take. We have effectively been in a crab market since January 7th, with BTC oscillating in a range between approximately $35,000 and $45,000. Furthermore, price volatility has been decreasing into a narrower and narrower band, which is usually indicative of a pending big move.
Easy bet right now imo is on vol increasing.
With the FOMC meeting on March 15th - 16th, that could well be the event that provides the gunpowder for the market's next move.
Until then, I am in a wait and see mode. Call me cautiously pessimistic. In the mean time, I have been checking out some on-chain data, which is often as helpful as reading tea leaves.
Still, there is some interesting data that can be gleaned from the 0n-chain analytics at this time.
Let's dive into the data.
Whales vs. Small Fish
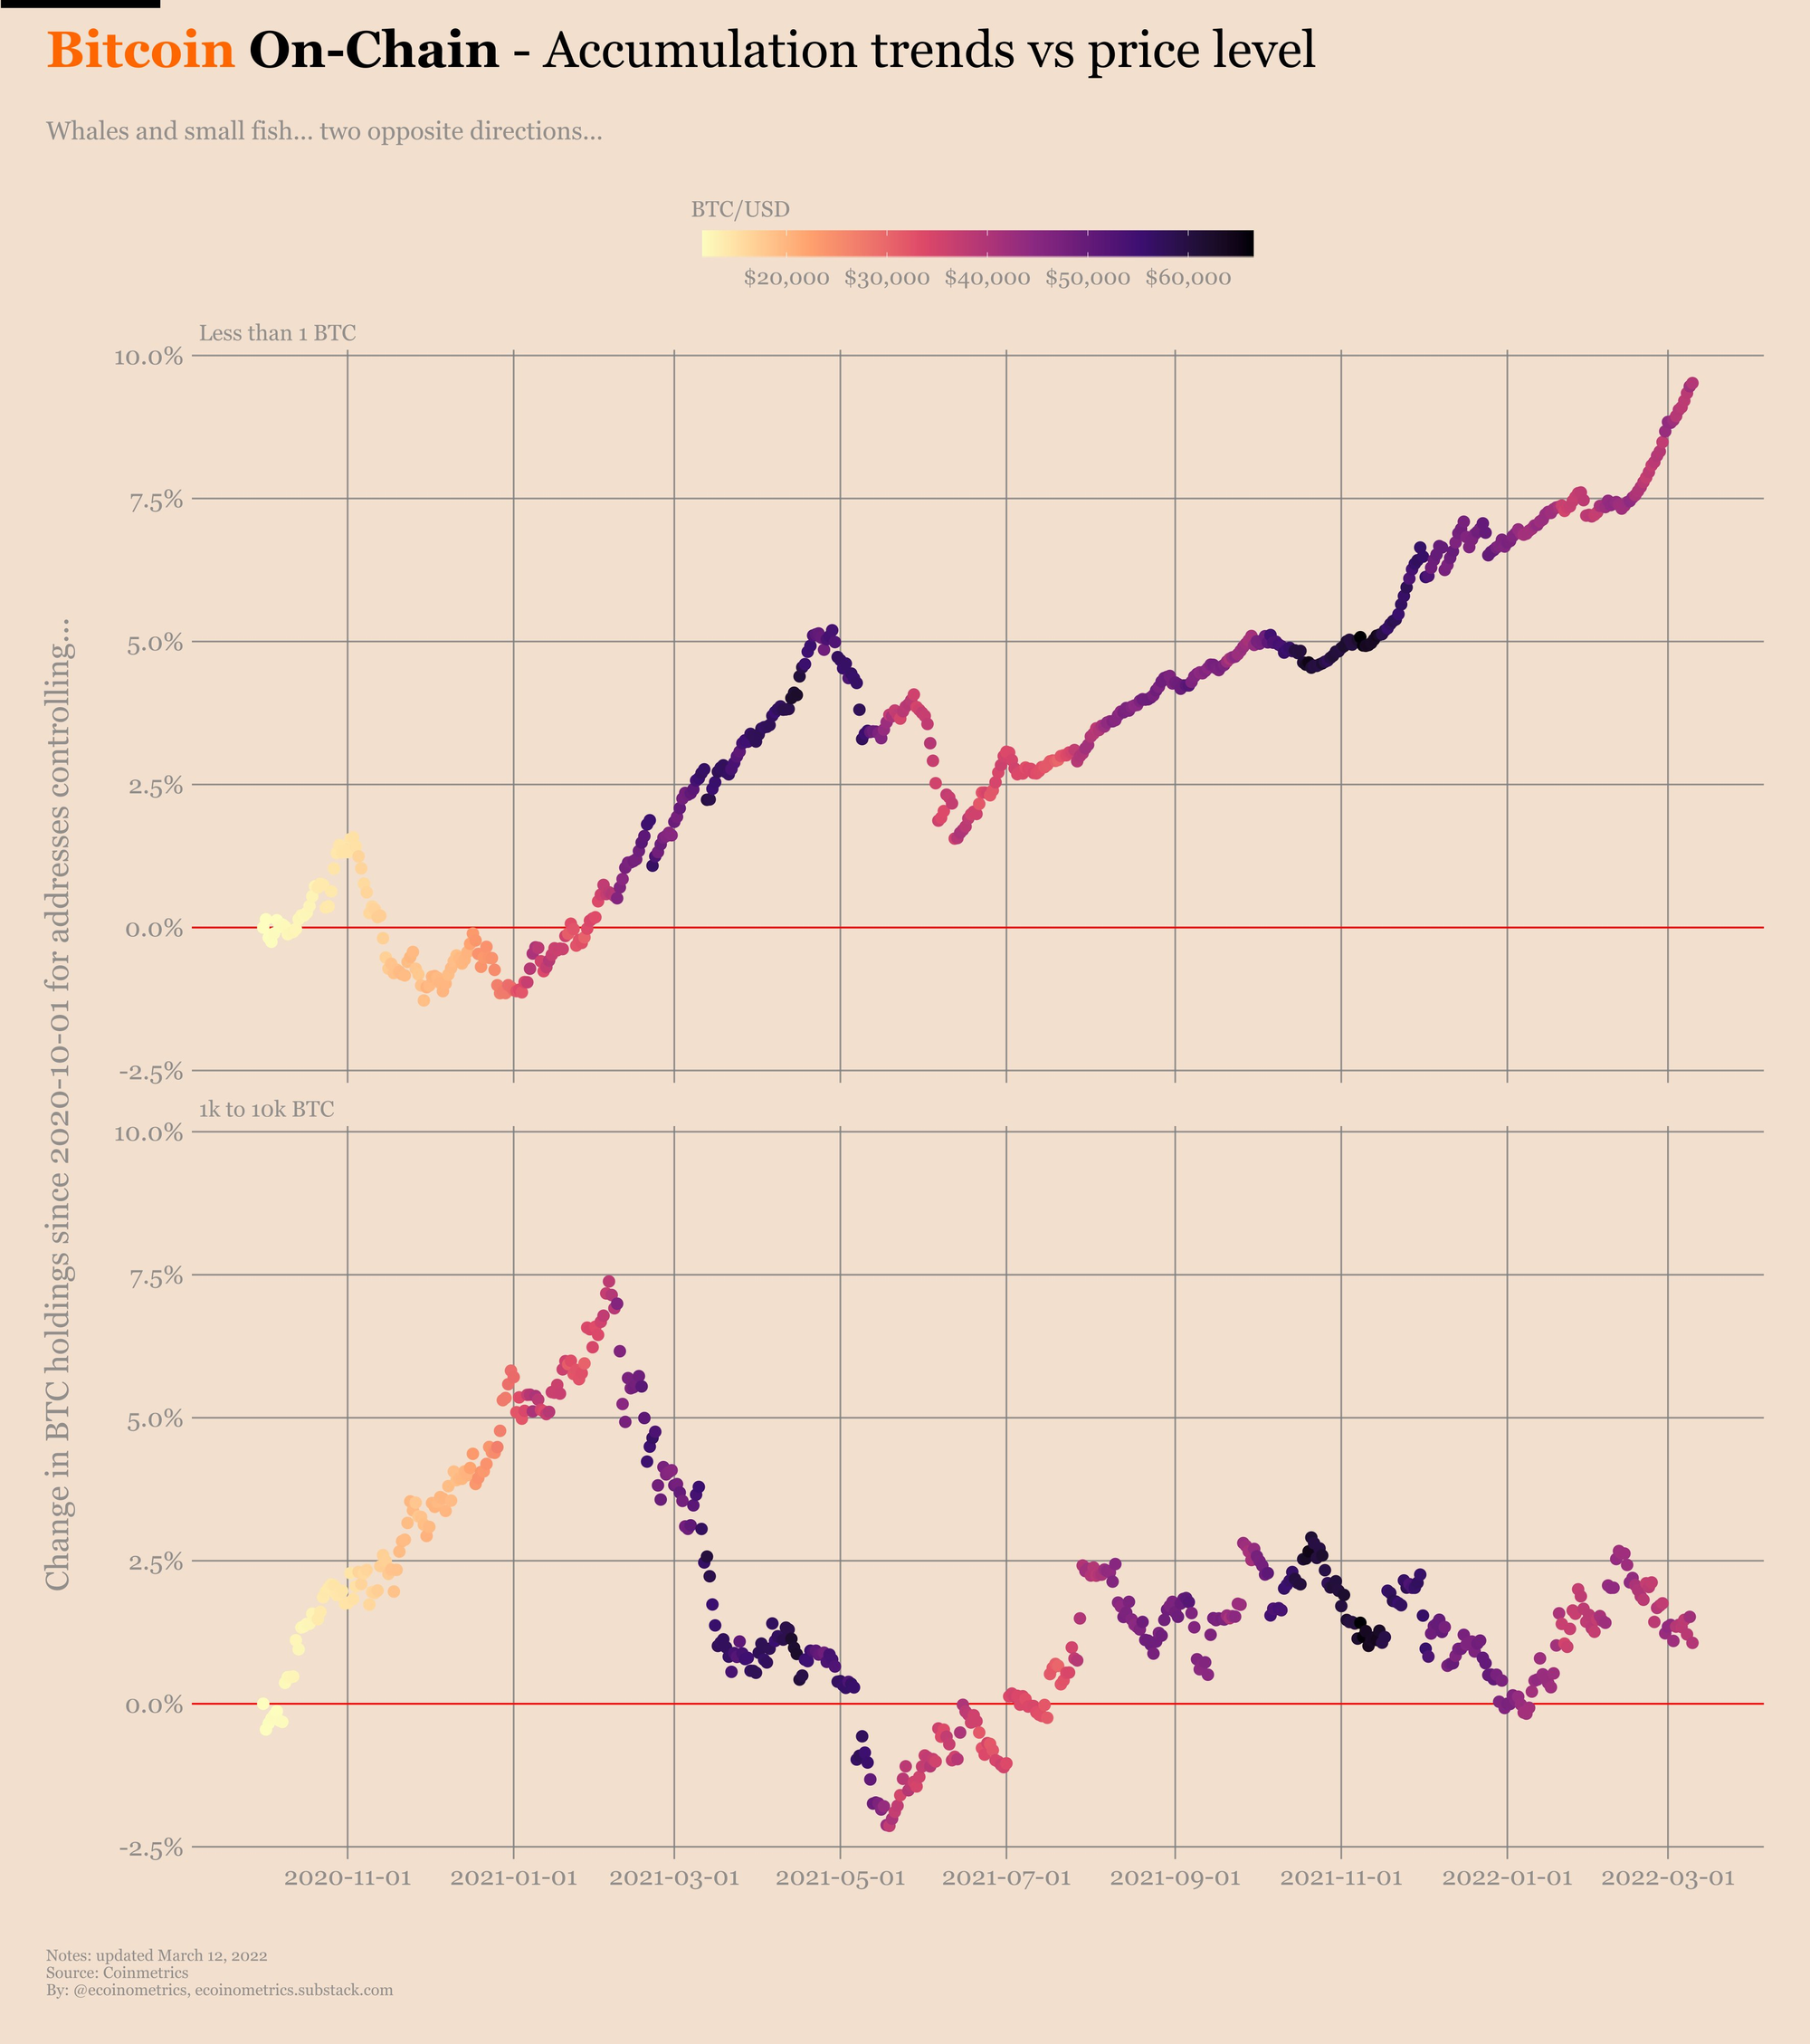
This graph, taken from Coinmetrics' data set, shows some interesting trends. Specifically, small fishes (addresses that hold less than 1 BTC) have been relentlessly accumulating more BTC since June 2021, while whales (addresses that holder 1k to 10k BTC) have been generally been offloading BTC since February 2021. Furthermore, whales are by no means in an accumulation pattern for BTC.
The general takeaway here is that small holders are accumulating BTC while big holders are not focused on accumulation right now.
Coins on exchanges at a low
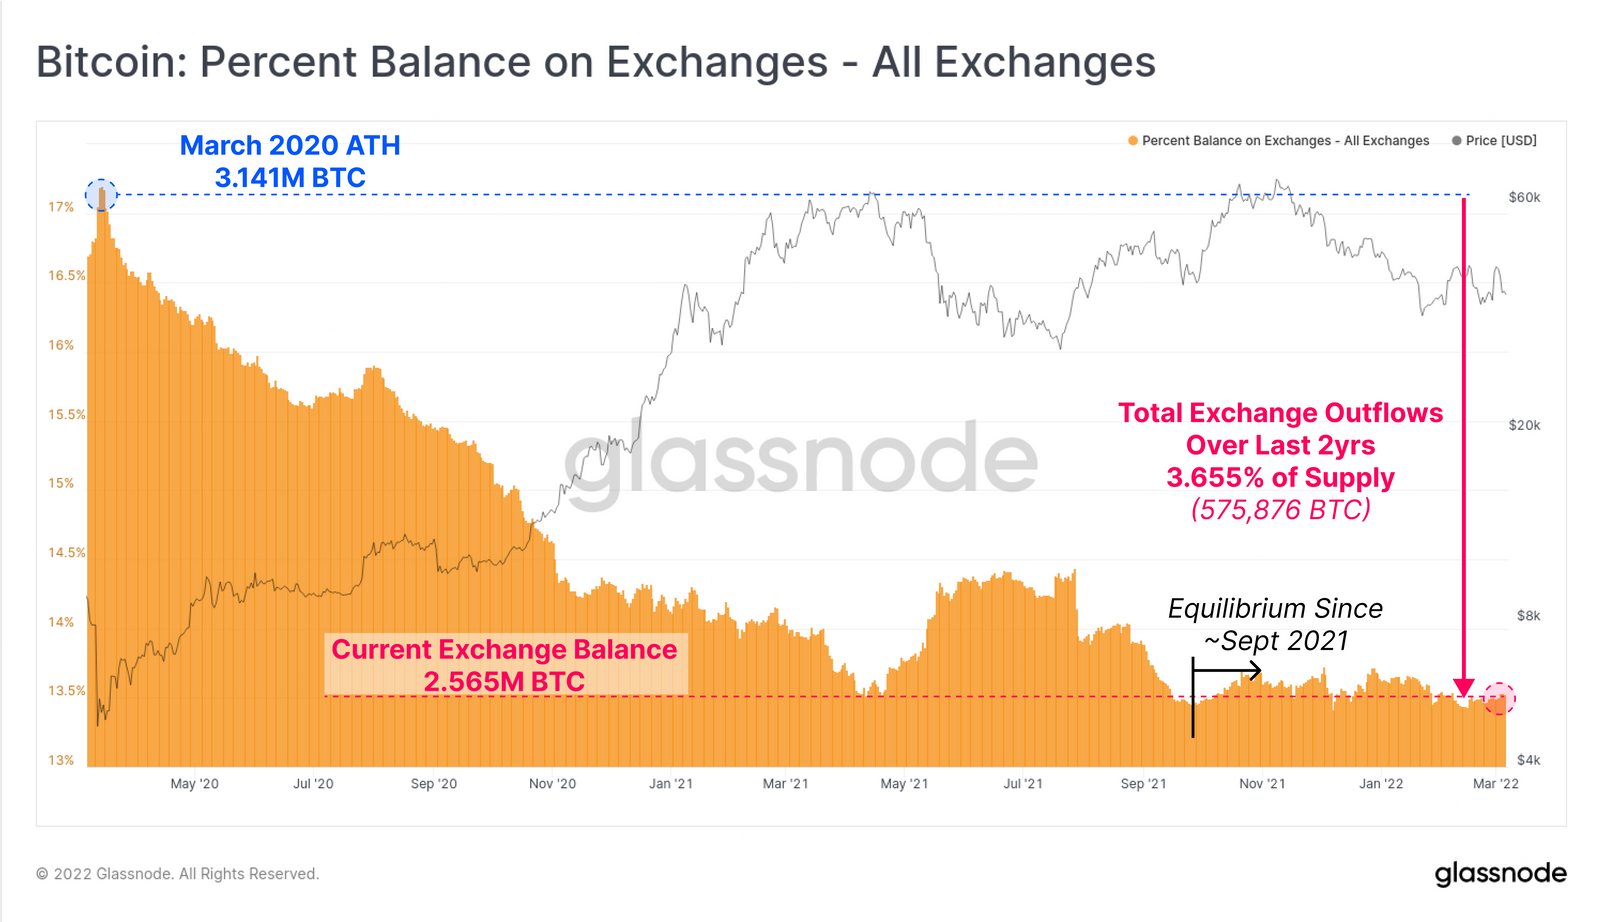
Interestingly, coins on exchanges are at a multiyear low. Approximately 13.5% of of BTC remains on exchanges, meaning many users are still taking BTC off exchanges and moving them into their own wallets.
This graph paired with the the small fish accumulating graph tells the story that smaller holders have been moving their assets off of exchanges into their own wallets and are likely driving the drop in supply of crypto on exchanges.
Stabelcoins being redeployed
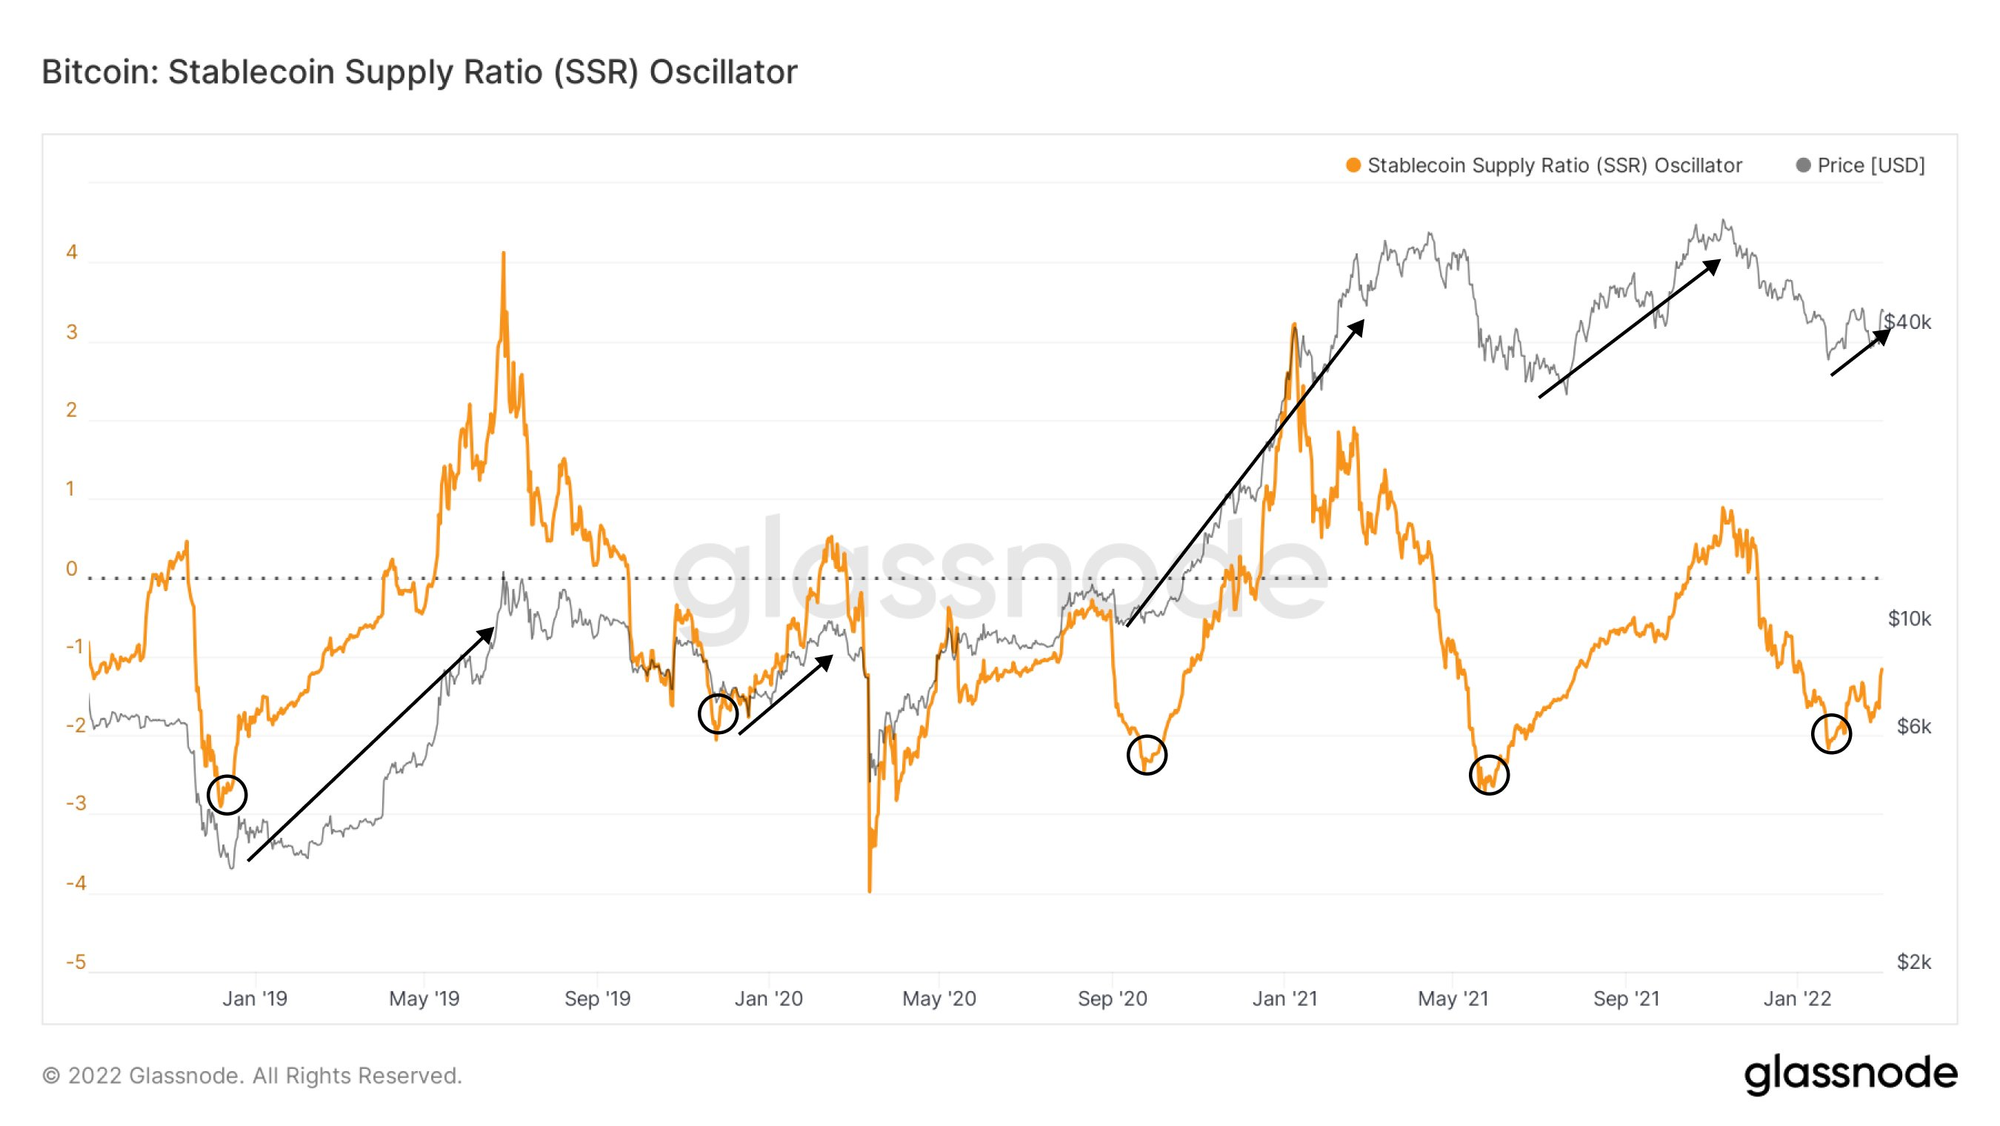
Recently, users have been redeploying their stablecoins back into the market. The stablecoin supply ratio (SSR) is the ratio between Bitcoin supply and the supply of stablecoins. When the SSR is low, the current stablecoin supply has more "buying power" to purchase BTC. It serves as a proxy for the supply/demand mechanics between BTC and USD.
SSR looks to have found a local bottom in late January and has been increasing since then, meaning there is redeployment of capital from stablecoins into the market. Many times, the redeployment happens in trends, though there are plenty of examples in the graph above when the change in deployment trends has only been short term one.
That being said, there have been many times when the SSR started entering a uptrend indicated price had found a local bottom, as can be seen by the circles on the graph.
Takeaways
The on-chain data picture right now is mixed. The lack of accumulation from whales, while fish are accumulating, usually is not a positive sign for the market. While I have seen many people point to coins being low on exchanges leading to a supply shock, the market still needs to see a surge in demand for that supply shock to take place. Just because there are not many coins on exchanges does not mean there are reasons for users to buy, which would have theoretically a larger effect on price because of the lack of liquidity.
Stablecoins being redeployed is a positive sign for the market, but there have been many times the redeployment trend has been short lived. Usually, it more tracks the market than leads.
I remain approximately 95% in cash. The on-chain picture is not clear enough to overturn my bearish thesis on the market, which is driven by the decreasing user growth, lack of innovation, and a terrible macro environment.
Disclaimer:
The Content on this email is for informational purposes only, you should not construe any such information or other material as legal, tax, investment, financial, or other advice. Nothing contained on this site constitutes a solicitation, recommendation, endorsement, or offer by Rapture Associates or Mattison Asher or any third party service provider to buy or sell any securities or other financial instruments in this or in in any other jurisdiction in which such solicitation or offer would be unlawful under the securities laws of such jurisdiction.
All Content on this site is information of a general nature and does not address the circumstances of any particular individual or entity. Nothing in the Site constitutes professional and/or financial advice, nor does any information on the Site constitute a comprehensive or complete statement of the matters discussed or the law relating thereto. You alone assume the sole responsibility of evaluating the merits and risks associated with the use of any information or other Content on the Site before making any decisions based on such information or other Content. In exchange for using the Site, you agree not to hold Rapture Associates, Mattison Asher, and its affiliates or any third party service provider liable for any possible claim for damages arising from any decision you make based on information or other Content made available to you through the Site.